The Raspberry Shake is a miniature seismometer that measures vertical ground motion. It was developed by a Panama/Germany team as described here.
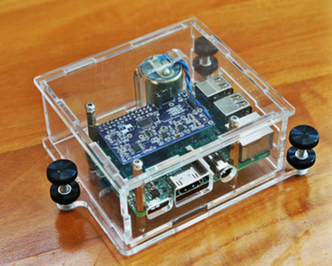
This is a picture of the Raspberry Shake (RS).
The cyclinder is a geophone that measures vertical velocities and the blue circuit board is the RS processor.
It is mounted on a
Raspberry Pi single board PC.
The Raspberry Pi with Raspberry Shake is mounted in a perspex case with levelling screws.
My one sits in a cupboard in a bedroom on the ground floor which already had power and internet (for a TV).
That's all you need.
The data are recorded as "counts" at 50Hz.
To convert from counts to physical units, you need to divide counts by 469.087 to get micro-meters/s, μm/s.
The data are stored in daily files in miniSEED format. Acronyms abound in seismology (as in any field).
Here are a couple of important ones:
The best way to see your data is by means of a display called a "helicorder".
The Raspberry Shake software has one, but I prefer this one from
SWARM
because it is easily configurable.
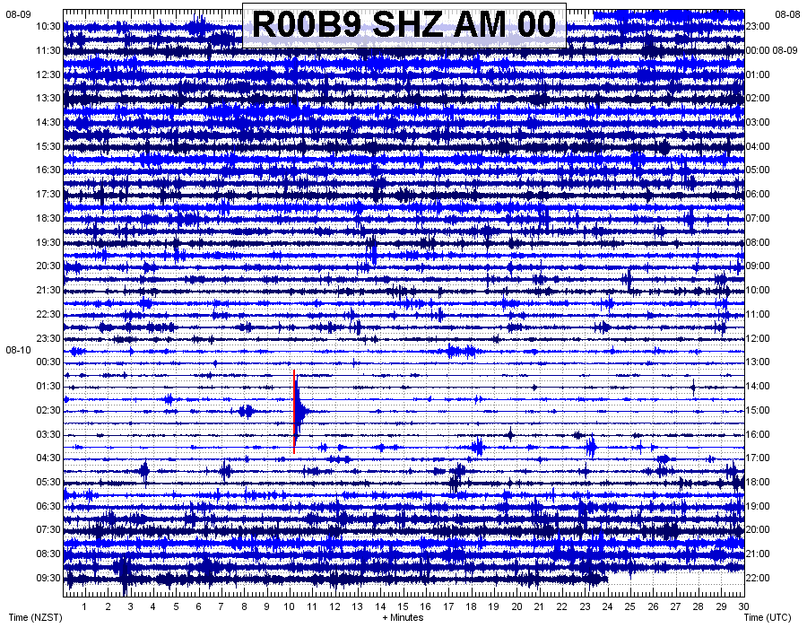
What the helicorder shows is half-hourly lines of oscillations in vertical ground motion.
The dark blue oscillations indicate high frequency, while light blue oscillations indicate lower frequency.
You can see a small EQ occurred at 2:40 NZST (left scale) or 14:40 UTC (right scale).
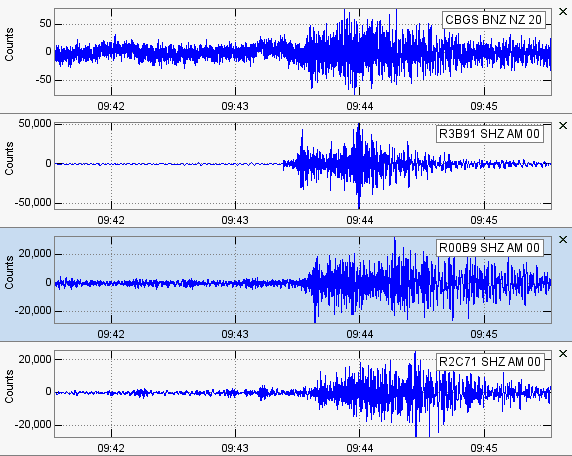
SWARM can be used to zoom-in into the helicorder for several stations, as shown below
which was for an EQ of magnitude 4.9 at a depth of 8.8 km with epicentre 243 km away.
My Riccarton/Hagley RS has a site number R00B9 and is sited at 87 Brockworth Place as shown below.
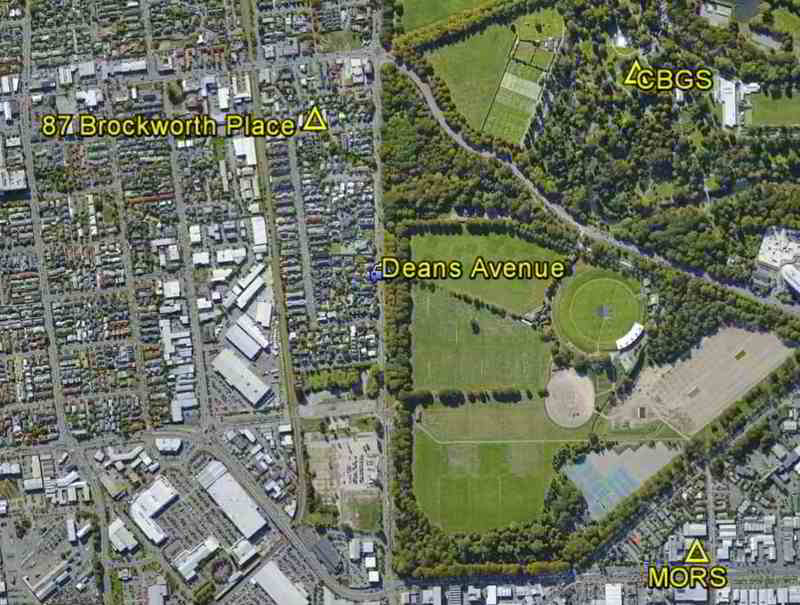
The Riccarton/Hagley raspberry shake is 100 m from Deans Ave, a major thoroughfare in Christchurch with an average of 13,000 vehicles per day,
most of them between 7 am and 7 pm
and the helicorder display reflects that with small oscillations at night and larger ones during the day.
An analysis of the background oscillations caused by traffic is presented
here.
Some of the other features in the signal of the Raspberry Shake are:
Two accelerometers from the GeoNet network are sited close by, as shown in the map.
They are:
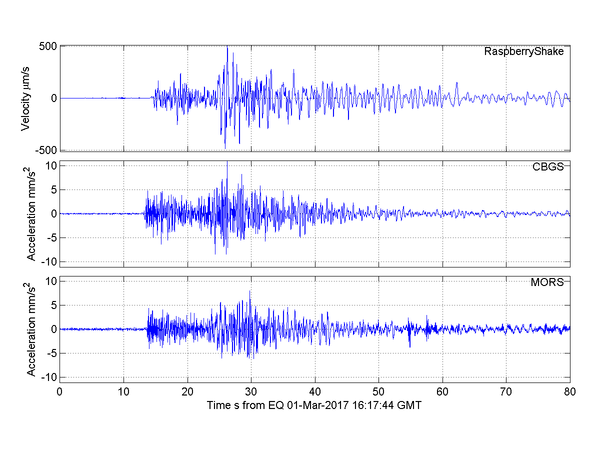
They are much more sophisticated instruments than the Raspberry Shake, being higher spec and measuring accelerations in 3D. However, when it comes to recording an earthquake, they perform in the same way as shown here:
I've also installed a raspberry shake (Station RC144) at our bach at Port Levy on Banks Peninsula.
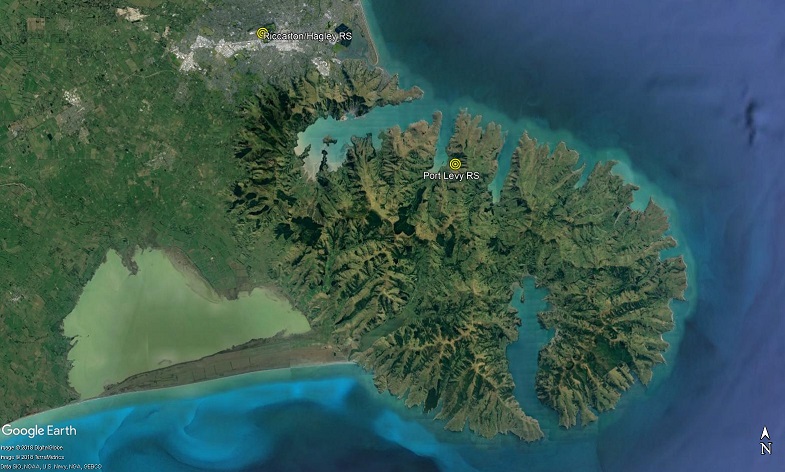
The environment at Port Levy is quite different to Riccarton/Hagley:
So, how different are the signals?
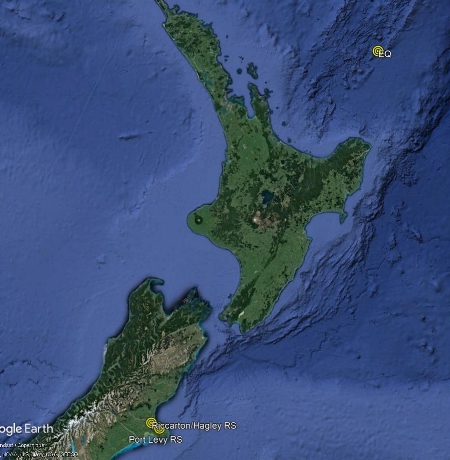
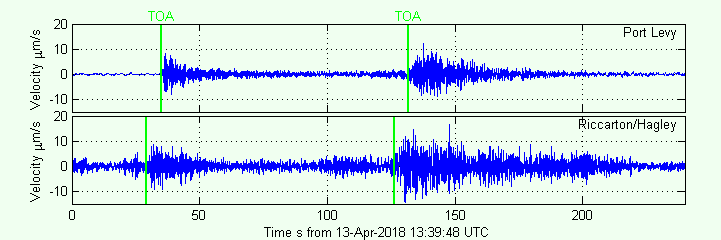
At 13:39:48 UTC on 13-Apr-2018, there was an earthquake of 5.5 magnitude 184 km deep at a location 210 km N of Te Araroa, 1000 km NE of Port Levy.
Here are the RS measurements:
At 17:44 UTC on 25-Feb-2018, there was an earthquake of 7.5 magnitude in the highlands of PNG. It killed 160 people.
The details are
here.
Here are the RS measurements:
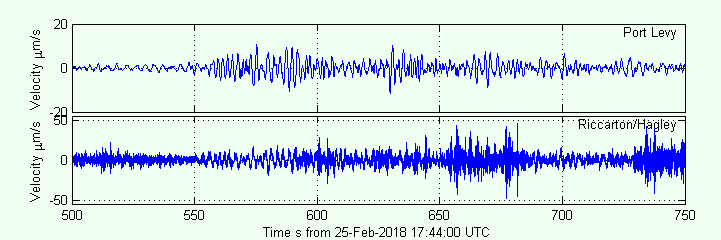
Note the different vertical scales in the plots.
In this case, the EQ is clearly identifiable at Port Levy because it exceeds the background noise,
but at Riccarton/Hagley it is obscured by the background noise,
though it can still be seen as a series of waves with longer period than the background noise.