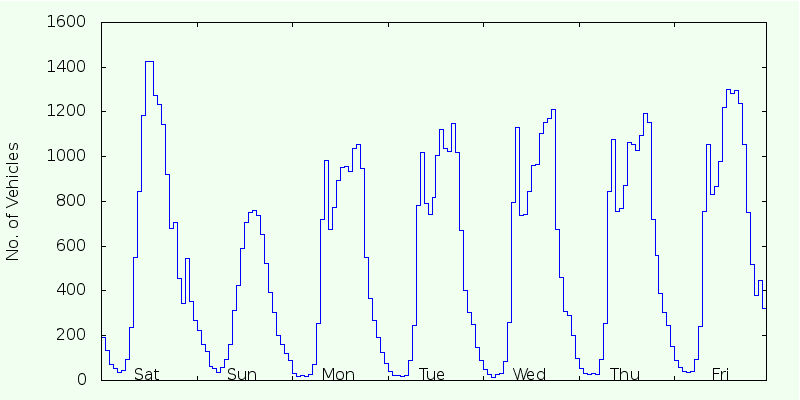
The plot shows the hourly traffic volume for a week in May 2012.
There are a number of points that arise:
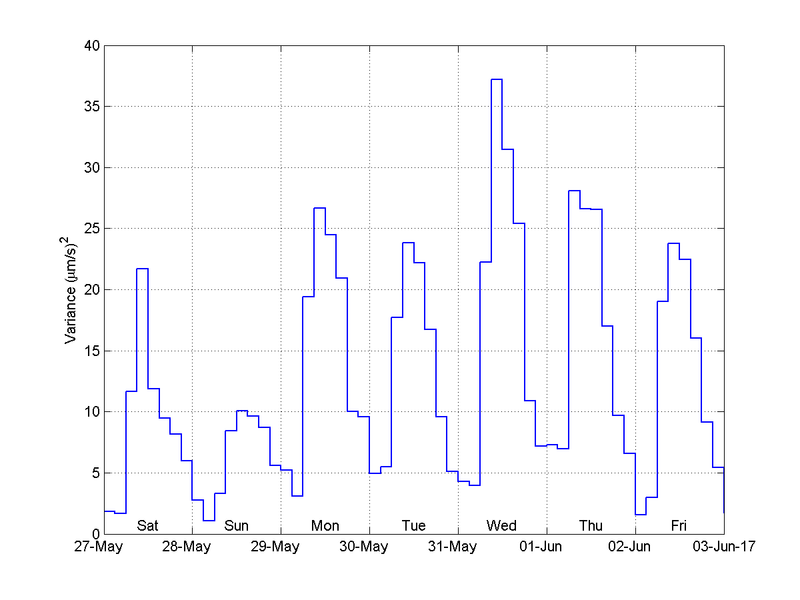
The plot shows 3-hourly variances of vertical ground velocity as measured by my Raspberry Shake for a week at about the
same time of year as the traffic volume plot. It is typical for a week when there have been no earthquakes.
Variance is a measure of the energy in the signal. Mathematically, it is the standard deviation squared.