 2016 Kaikoura Earthquake
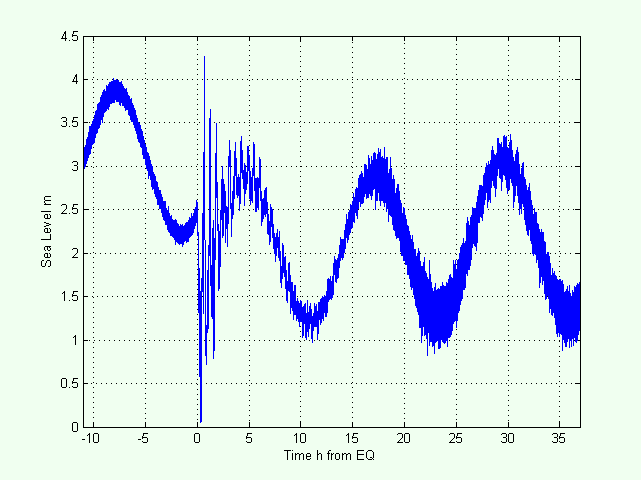
The Magnitude 7.8 earthquake of 13-Nov-2016 at Kaikoura caused the land to lift up by about 1 m.
As the land rose, it took the tsunami gauge KAIT with it.
The gauge which measures depth interpreted this as a suden decrease in depth, as shown below.
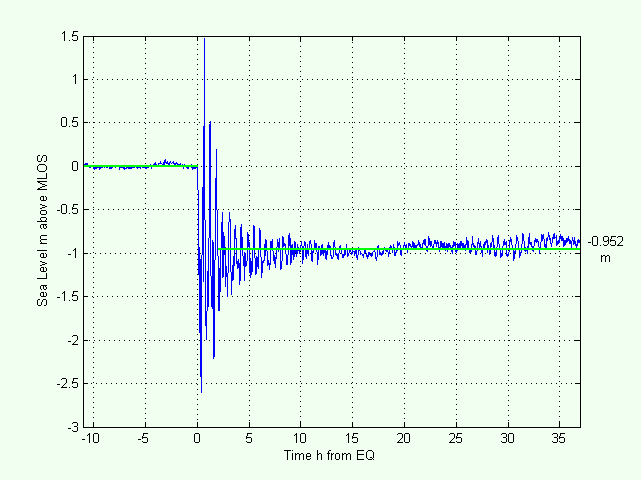
The numerical routines that are used to separate FIG waves from other effects include a despiking routine that detects
jumps in sea level. Usually, these are spurious data caused by data errors of one kind or another.
When these routines encountered this signal, they rejected the jump in sea level as spurious and carried on.
Unfortunately, this resulted in erroneous estimates of wave heights.
Hence the warning. If the FIG Waves: Time Series plot looks like the one above, the wave heights will probably be wrong.