 Today's Storm Surge
When you get tides for today, you are given how much to add for storm surge.
Of course, if the number is negative, you will need to subtract it.
This webpage explains what it means and how it has been calculated.
Storm surge is the response of the ocean to changing atmospheric pressure and winds.
Yesterday's Storm Surge
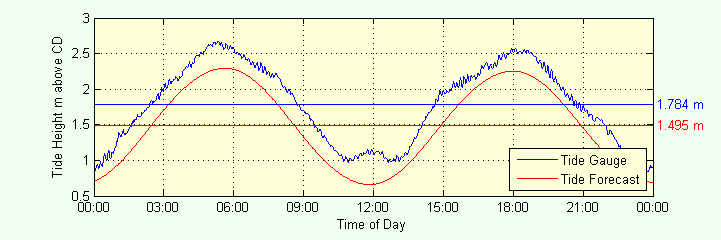
To the right is a plot of the tide forecast and actual data from the Lyttelton tide gauge.
The jagged nature of the actual data is caused by the presence of waves of various periods.
We will ignore these for this exercise.
You will see that the actual data are displaced upwards from the tide forecast.
This is the effect of storm surge (and other minor effects that are listed below).
The amount by which the curve of actual data is shifted up is the difference in the means which are listed to the right of the plot.
For this example, the difference is 1.784 - 1.495 = 0.289 m.
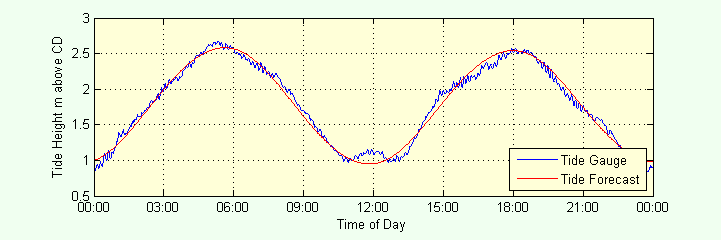
So, the actual height of sea level at high and low tides on this day were 0.289 m above the forecast levels.
By adding 0.289 m to the forecast tide, we get the comparison shown in the lower plot.
Other long-period components that cause sea level to be different from the forecast tide are:
- Annual Cycle — fluctuations of about ± 100 mm that result from seasonal changes in temperature.
- El Niño/La Niña — fluctuations of about -40 mm for El Niño and +40 mm for La Niña on an 8-year cycle.
- Sea Level Rise — increasing at a rate of 1.8 mm/year at Lyttelton.
Today's Storm Surge
We can use the Lyttelton tide gauge record to calculate yesterday's storm surge, but what will today's storm surge be?
In weather forecasting, there is a concept called "skill" that measures the efficacy of a forecasting system.
A forecast of zero skill is to assume that what happened yesterday will be what happens today.
A forecasting system is only effective if it is better than this (it's skill is greater than zero).
For storm surge at Lyttelton, there is no better estimate of what the storm surge will be today than yesterday's storm surge.
We can assess the errors involved in using yesterday's storm surge for today by analysing historical data,
comparing one day's storm surge with the next over several years of record.
For the 2 years of data from 1-Jan-2013 to 1-Jan-2015, the statistics are shown in the table to the right.
The mean is zero, which means that on average, over many days, we can expect the estimate to be correct.
For any particular day, there is a 95% probability that the error will be between -0.134 m and 0.121 m.
The small negative skewness means the large negative errors are slightly larger than the large positive errors.
The positive, but small, kurtosis means that there a few rogue spikes — the event that produced the minimum error of -0.332 m is one of these.
If the kurtosis were 5 or larger, there would be more than just a few of these spikes and we would need to look for data errors.
If the mean, skewness, and kurtosis were zero, the errors would be distributed normally and we could write:
95% confidence interval = ± 1.96 * Standard Deviation = ± 0.125 m.
which is pretty close to the 2.5% and 97.5% exceedances in the table.