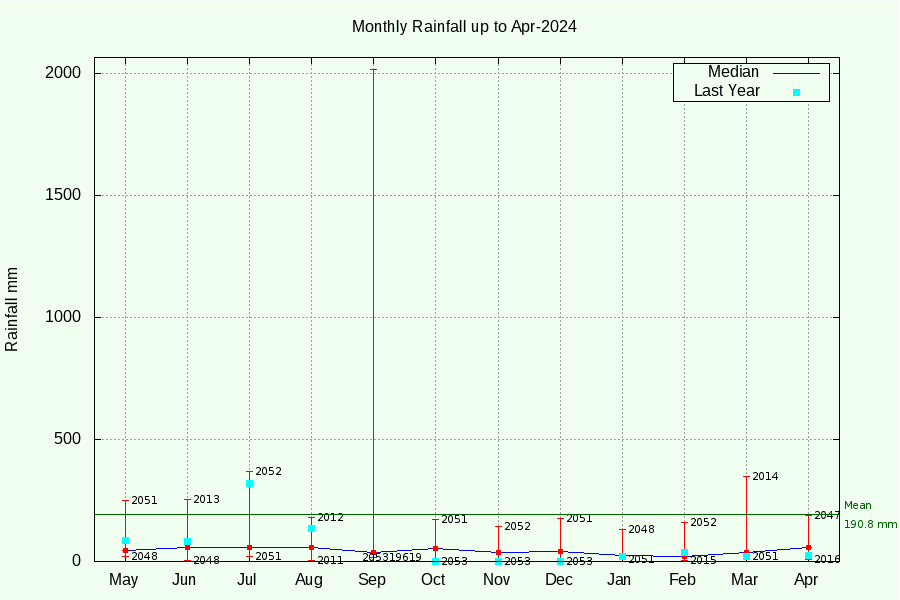
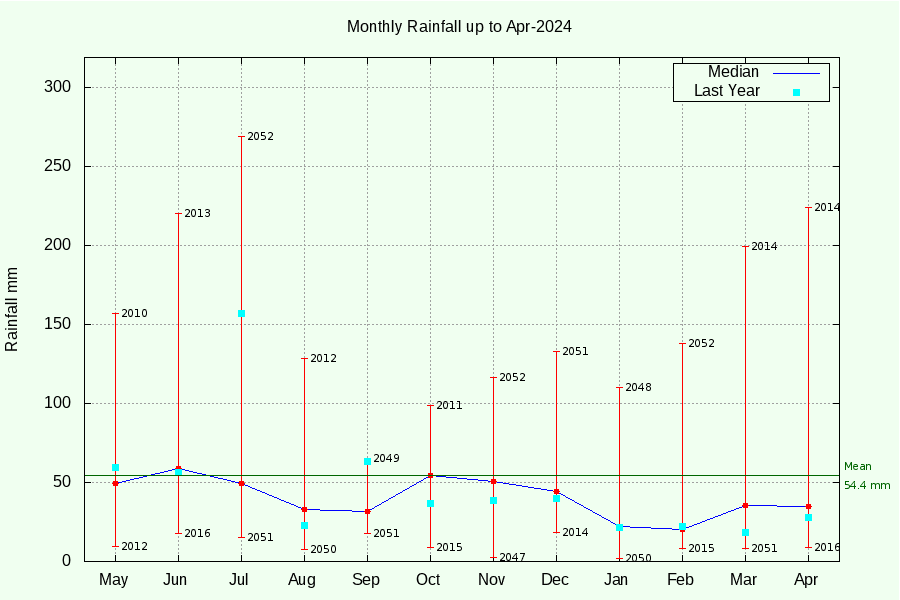
The monthly rainfall for the PWSs (Personal Weather Stations) at Port Levy and Riccarton/Hagley are shown in the plots below.
Here are a few notes about the plots:
- The year when the maximum and minimum rainfall for that month occurred are noted at the top and bottom of each line.
- The median rainfall for that month for the entire record is a red square.
- The rainfall that occurred in that month in the last year is a cyan square
- The annual mean monthly rainfall is shown as the green line.
Multiplying this value by 12 will give the mean annual rainfall (about 0.6 m)
- The very large rainfall in Mar-2014 (332 mm) at Port Levy is not an error. It actually occurred and caused flooding with some damage to the bank of our stream.
There's a description of the event
here.