 Wavelet Details
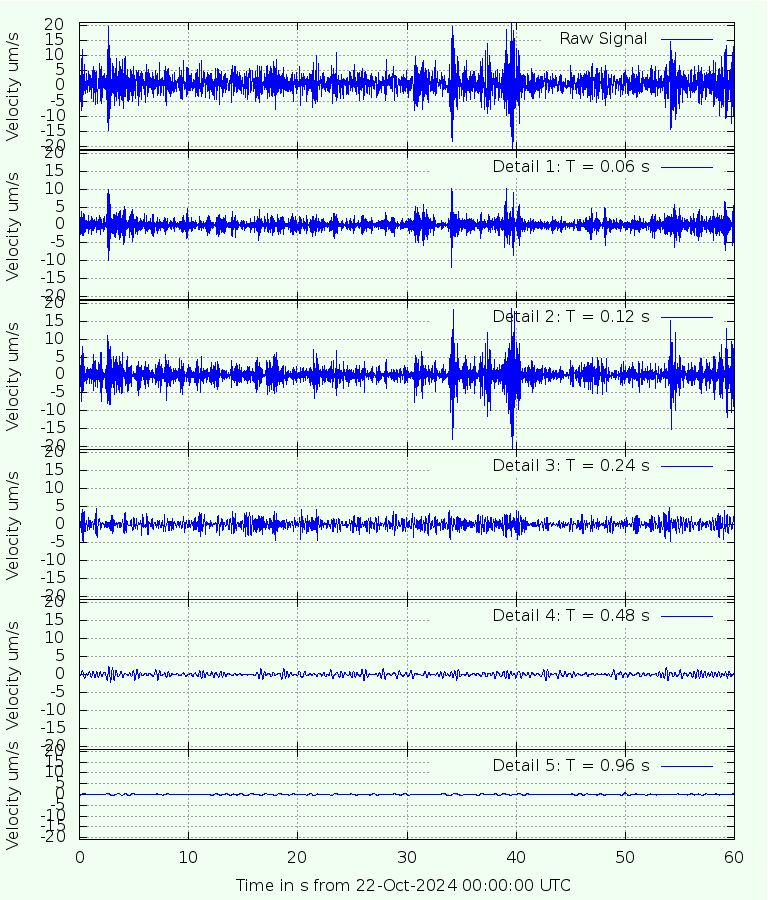
The raw signal can be split into a set of components using orthogonal wavelet decomposition.
This produces a set of "wavelet details", each having a nominal timescale, as shown below.
Details 1 to 5: Timescales up to 1 s
Details 6 to 11: Timescales above 1 s
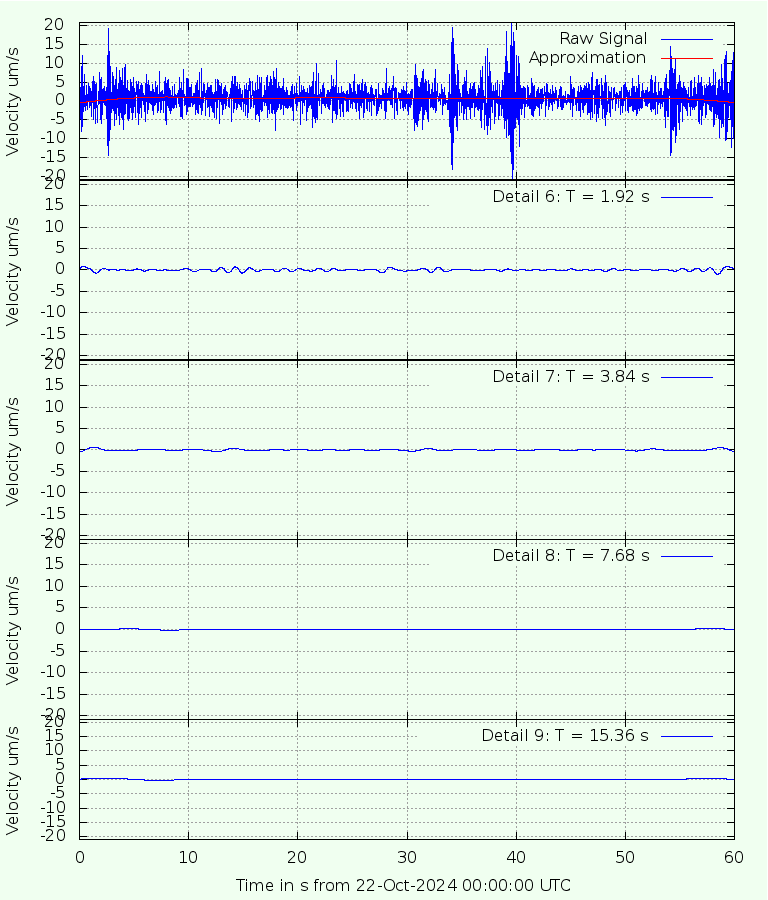
Table of Variances
In the table below, the variances of the various wavelet details are listed.
The variance is a measure of the energy in each detail.
The first row shows the variance of the raw signal. This is the sum of all the other variances.
Each detail has a nominal timescale which doubles from detail to detail as we go down the list.
The bottom line is the remainder when sum of the variances for Details 1 to 9 is subtracted from the total energy.
It is called the approximation. For a geophone or accelerometer it is usually spurious, being drift in the instrument.
The rightmost column lists the percent of the total energy, indicating which are the important details.