Normally, the routines for FIG waves work fine for tsunami as well. However, the signal from Kaikoura after the magnitude 7.8 earthquake of 13-Nov-2016 played havoc with the routines, and here's why.
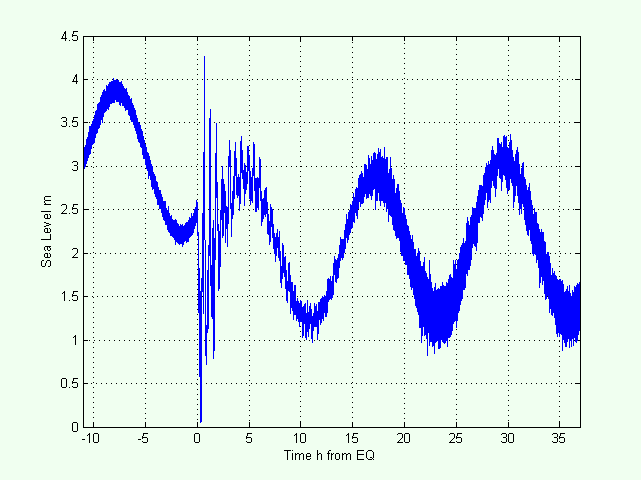
Here is the raw signal from the KAIT tsunami gauge at Kaikoura.
You can see the tide oscillating at 12.4 hour periods in the background, with waves on top.
Then at time 0 the earthquake occurred and the gauge went beserk for a few hours.
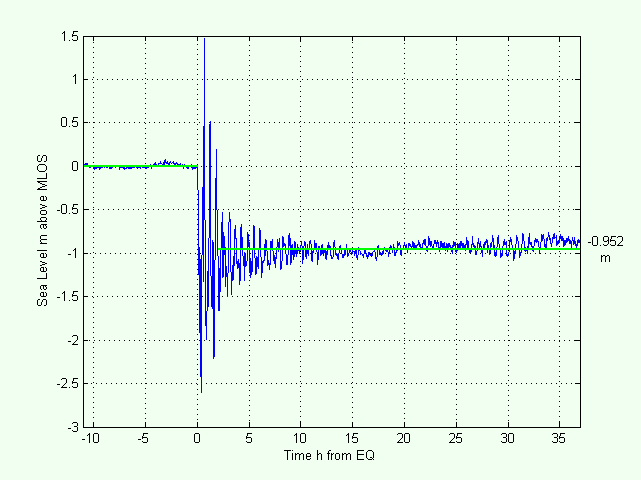
Here is the residual formed by subtracting the tide from the raw signal.
The green lines are MLOS (mean level of the sea).
They represent the long-term level of the sea after short-term oscillations (less than 2 weeks) have been removed.
You can see that the sea level has dropped by 0.952 m as a result of the earthquake.
In fact, what happened was that the land uplifted by 0.952 m in a few seconds after the earthquake, so the jump in sea level
was not real - it was the result of a displacement of the gauge upwards, thereby registering a reduction in depth.
Unfortunately, the FIG routines interpreted this as a spike in the data and eliminated it along with the next wave.
You'll see this if you try running the FIG routine with a finish date of 2016-11-16 and click Kaikoura.